Less Is Not Always More: Reduce Porosity With Geometry Optimization
Hyundai WIA produces differential gearboxes for automobiles made of ductile iron GJS-700. The demands on gearboxes are high: As safety-critical castings, they should be durable and withstand high mechanical loads. Therefore, the best casting quality is required to ensure durability, avoid unnecessary and costly repairs, and thus live up to the company’s good reputation.
Less Melt, More Problems
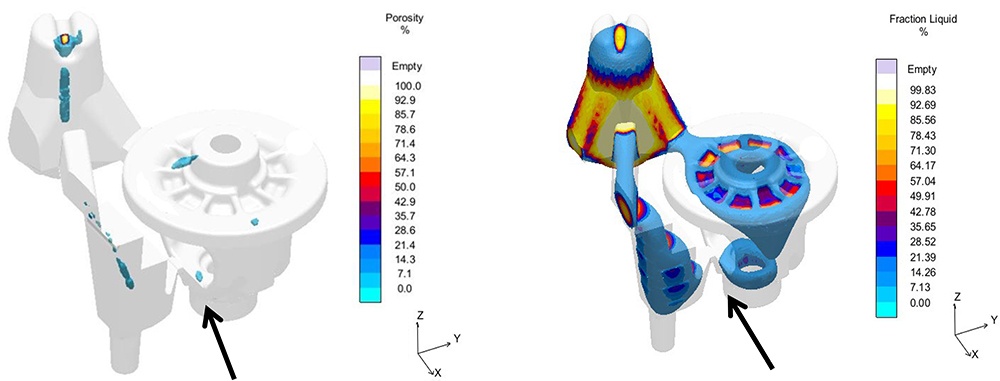
The product design seemed perfect. The objective of the foundry was to use as little material as possible, that is, to produce the part with optimal material usage. However, the result of the subsequent process development was not as good as required to meet the demands. The simulation of the preferred casting layout suggested a strong tendency towards shrinkage porosity. According to the simulation, this was due to feeder and feeder neck failing to compensate for the volume deficiency during solidification (Fig. 1).
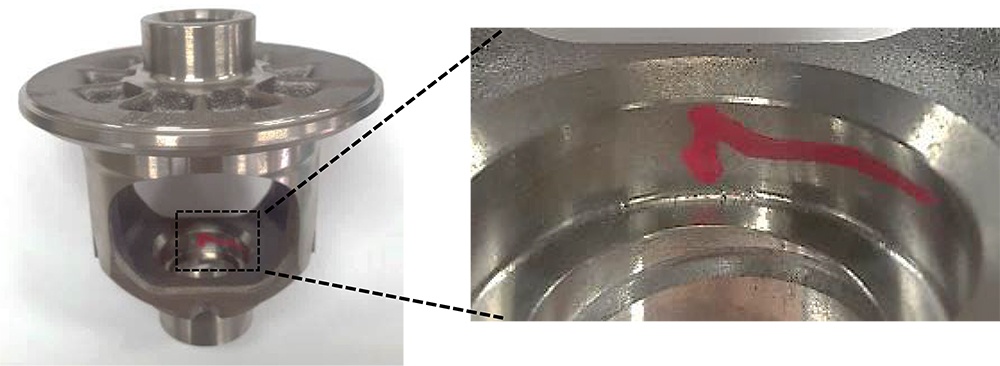
Hyundai WIA produced a prototype that confirmed the simulation results: The prototype showed excessive porosity in the critical areas. During service, the gearbox might not be able to permanently withstand the mechanical loads and might fail to meet the manufacturer’s quality standards. With this layout, series production was out of the question (Fig. 2).
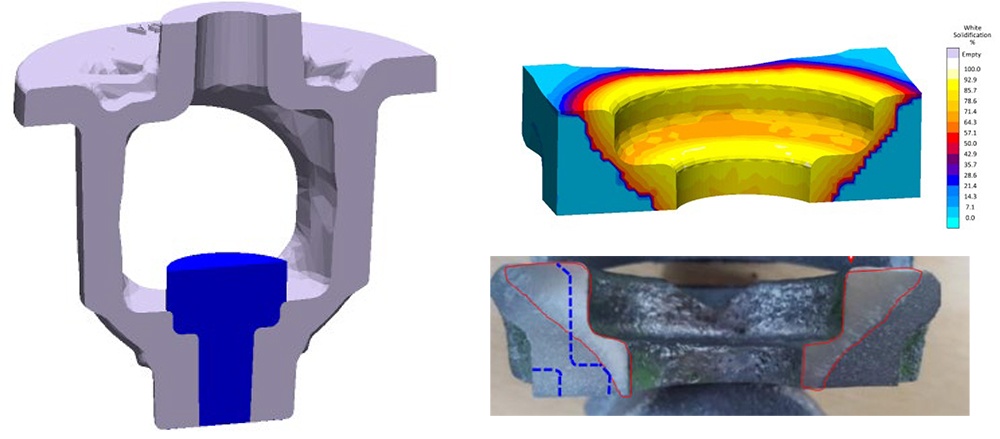
Was the product design salvageable? The solution to the problem was subject to a restriction: Hyundai WIA wanted to avoid an additional feeder. Therefore, the engineers tried to prevent the defect by placing a chill in the mold. However, simulation and prototype showed that in the immediate vicinity of the chill, the melt solidified too quickly, so that white solidification – typical of such a case – occurred (Fig. 3). As a result, the stability and quality of the product suffered. Moreover, severe wear of the tooling occurred during subsequent machining.
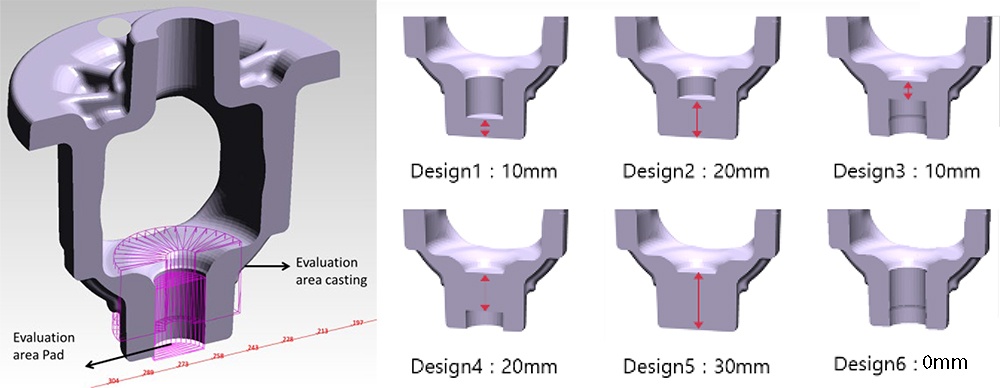
The foundry experts at Hyundai WIA wondered whether it would be possible to concentrate the porosity where it would not affect the part – namely, in an area that would be removed anyway during machining. They planned to fill up the hollow in the critical area of the casting by adding padding there. Figure 4 presents numerous possible padding thicknesses and positions.
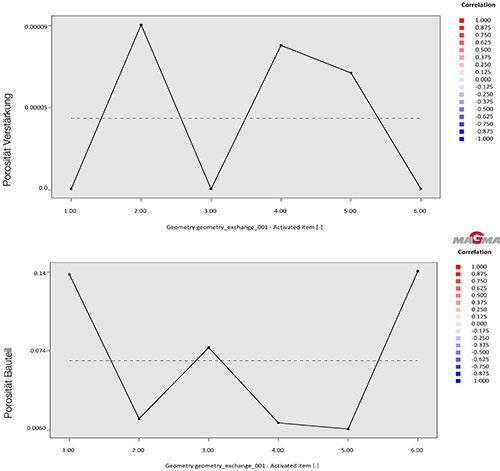
With so many possible solutions, MAGMASOFT® is the optimal tool. MAGMASOFT® not only helps to find these variations, but also to automatically evaluate them. For this purpose, two evaluation areas were used: one in the critical area of the casting and another one in the padding itself. In the end, MAGMASOFT® was used to investigate a selection of six different designs with regard to porosity (Fig. 5). But did the idea lead to the desired result?
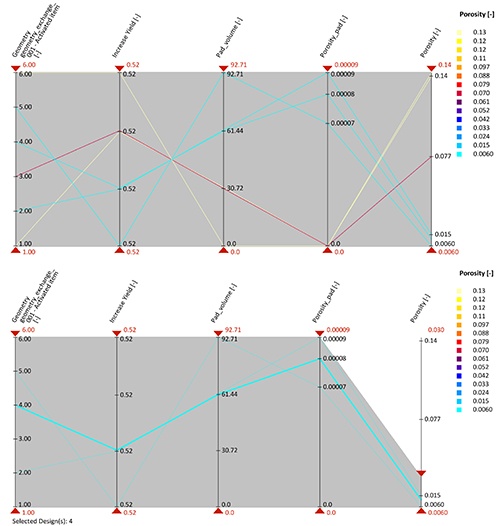
The assessment diagrams show the porosity in the padding (Fig. 5, left) and in the critical area of the casting (Fig. 5, right), respectively. The approach was promising: Depending on the arrangement and size of the padding, the porosity formed in the desired location and was reduced in the critical area – significantly so in designs 2, 4 and 5. The assessment was complemented by a parallel coordinate diagram to consider the yield when selecting the designs (Fig. 6).
Design 5 showed the lowest tendency towards casting defects, yet lead to a reduced yield. This would not only be unecological, but also cause an avoidable financial loss to the foundry. Taking into account the various demands on casting and production, design 4 turned out to be the best compromise for the product (highlighted light blue line in Figure 6, right).
The ratio between porosity and yield was optimal. Prototypes confirmed the simulation results, also in comparison with “worse” designs (Fig. 7): Only design 4 was considered for production. It was possible to completely eliminate the original defect in series production: The shrinkage porosity in the area investigated disappeared.
As Much as Necessary, as Little as Possible
With MAGMASOFT®, a casting was developed that met the high requirements in all respects. The simulation showed that material-saving production does not automatically equal sustainability – less is not always more. The extra material used in this example helped to reduce defects, scrap and future repairs – the durability of the final product speaks for itself. One more advantage: Practically at the push of a button, MAGMASOFT® helped to find a solution, thus substantially reducing the development time and offering future savings potential already at this stage. A win-win situation: In addition to the overall more economical production, Hyundai WIA more than lives up to its reputation for manufacturing high-quality products.
About Hyundai WIA
Hyundai WIA was founded in 1976 and has been manufacturing powertrains since 1979. Today, the South Korean company headquartered in Changwon is one of the leading manufacturers of automotive components. Hyundai WIA stands for cutting-edge technology and excellent product quality.
